Introduction
The Demographics tab summarizes cohort composition and concept-level demographic shifts.
The next example derives a few cohort-level summary values from the
bundled lc500 patient data. These are the same kinds of
inputs shown in the KPI cards and demographic overview panels.
if (requireNamespace("nanoparquet", quietly = TRUE)) {
  studyDir <- system.file("example", "st", package = "CohortContrast")
  study <- CohortContrast::loadCohortContrastStudy("lc500", pathToResults = studyDir)

  # Summarize overall cohort size and a couple of basic demographic indicators.
  data.frame(
    n_patients = nrow(study$data_person),
    median_birth_year = stats::median(study$data_person$YEAR_OF_BIRTH),
    male_proportion = mean(study$data_person$GENDER_CONCEPT_ID == 8507)
  )
}
#>   n_patients median_birth_year male_proportion
#> 1       1000              1953           0.538
The full Demographics tab expands this with cluster-specific summaries and concept-level age and sex shifts.
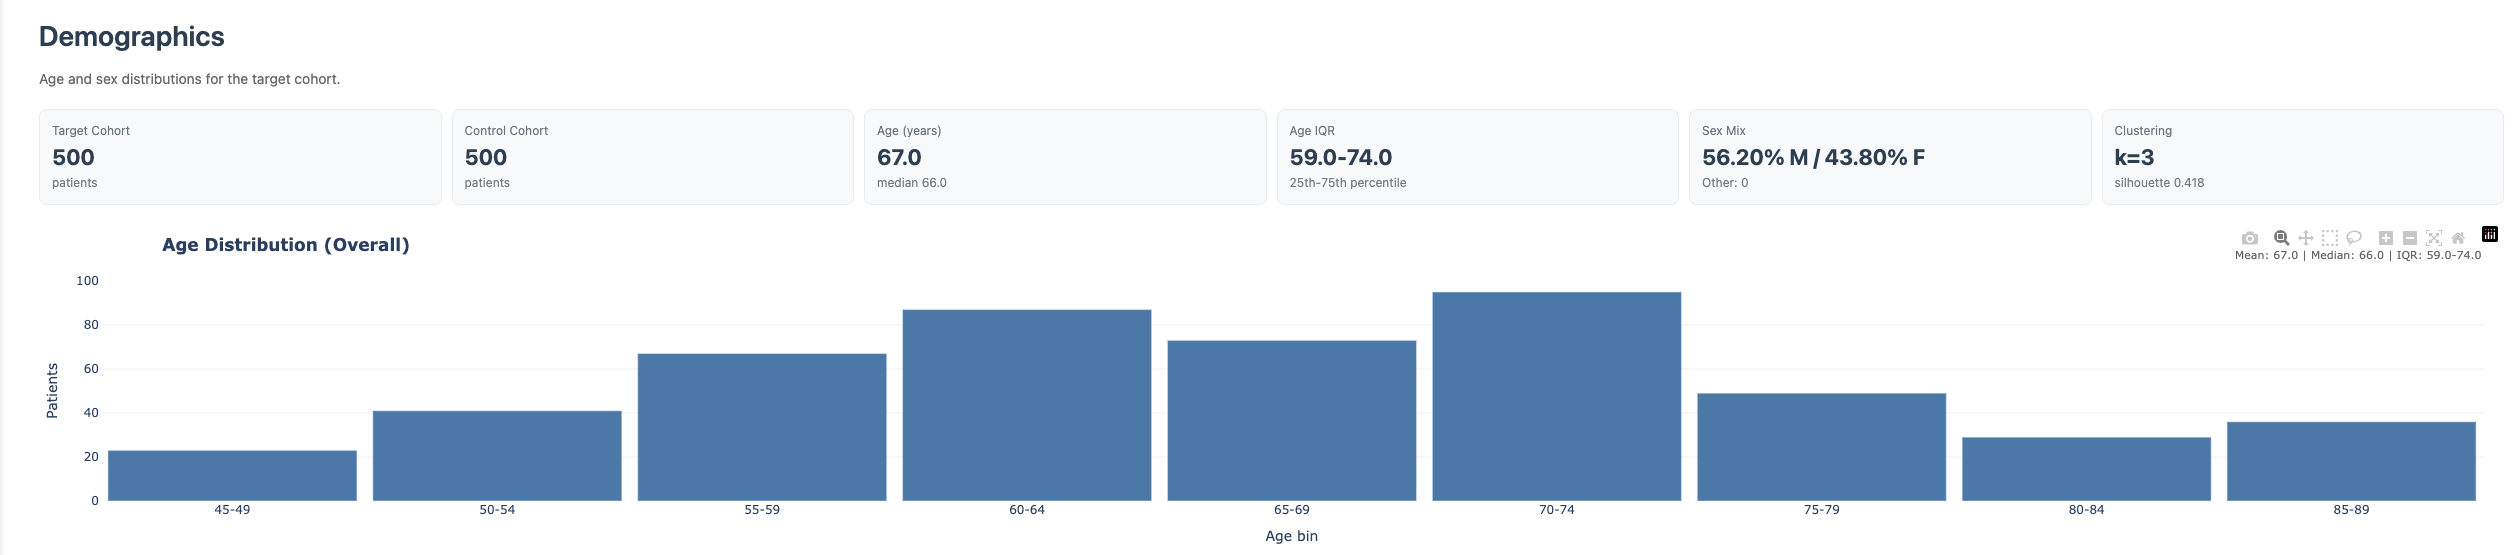
Demographics overview
Components
- KPI cards: cohort-level snapshot (patient count, age, sex proportions).
- Age distribution chart: cohort age profile with autoscaled axis range.
- Cluster Demographics table: per-cluster patient count and age/sex metrics.
-
Demographics by Concept:
- age-delta ranking table,
- sex-skew ranking table,
- filters for minimum patients and data source.
- Ordinal Progression: concept-specific age and sex patterns across ordinal events.
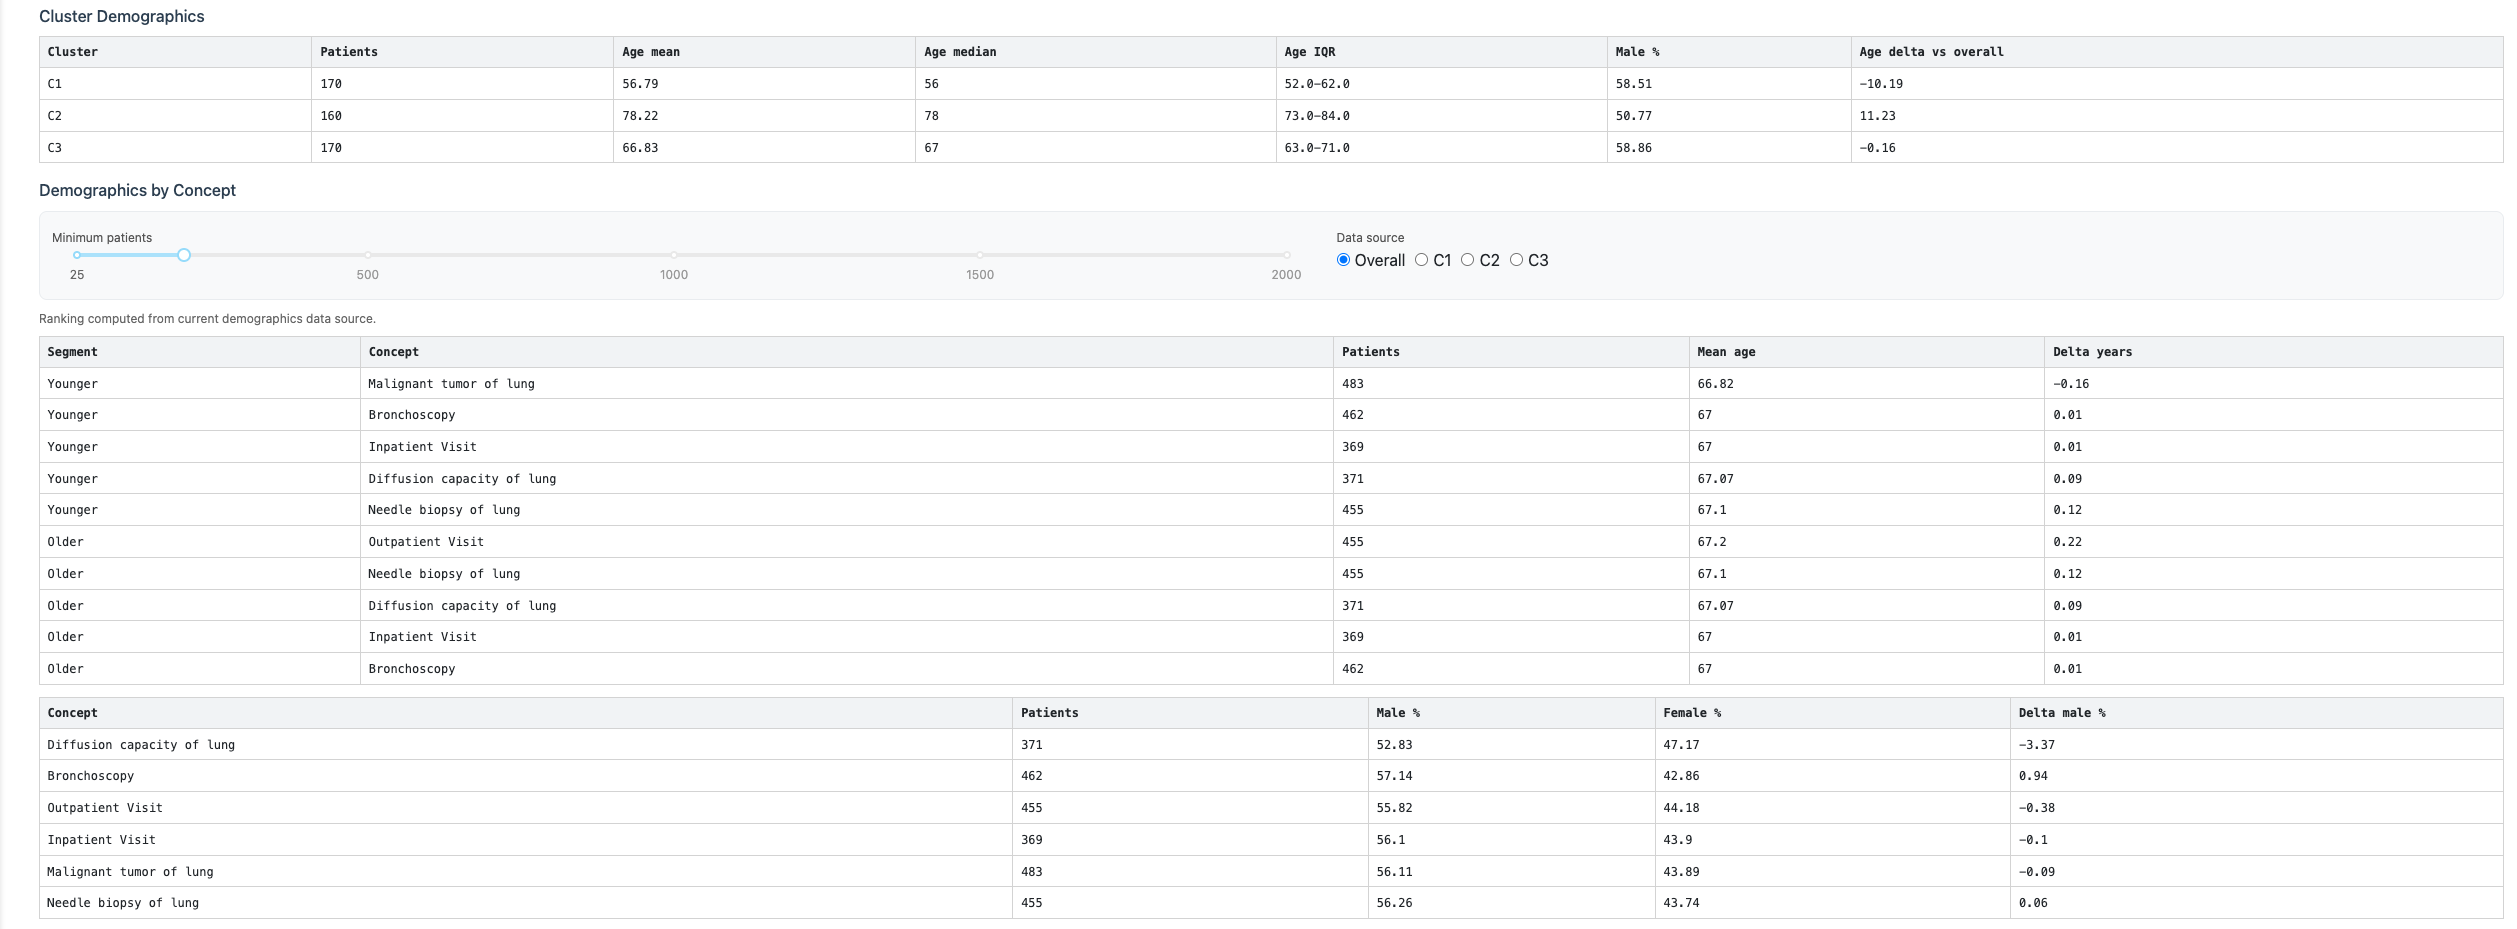
Demographics tables
Controls
- Minimum patients: excludes low-support concepts from rankings.
- Data source: switches between overall and cluster-specific demographic summaries.
- Ordinal concept selector: chooses the concept for ordinal progression charts.
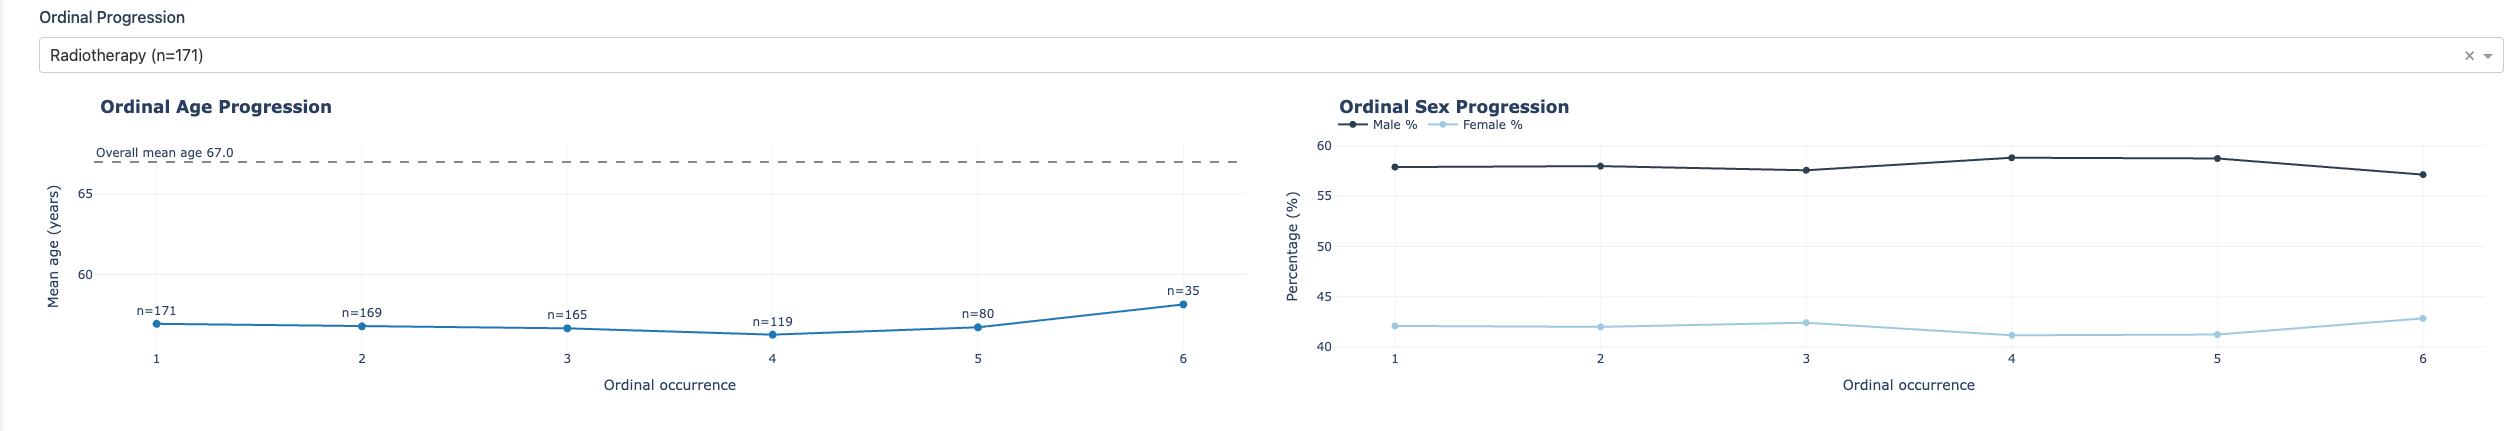
Ordinal progression panel